Shattered Chromosomes: Understanding Chromothripsis and Genome Rearrangement Models
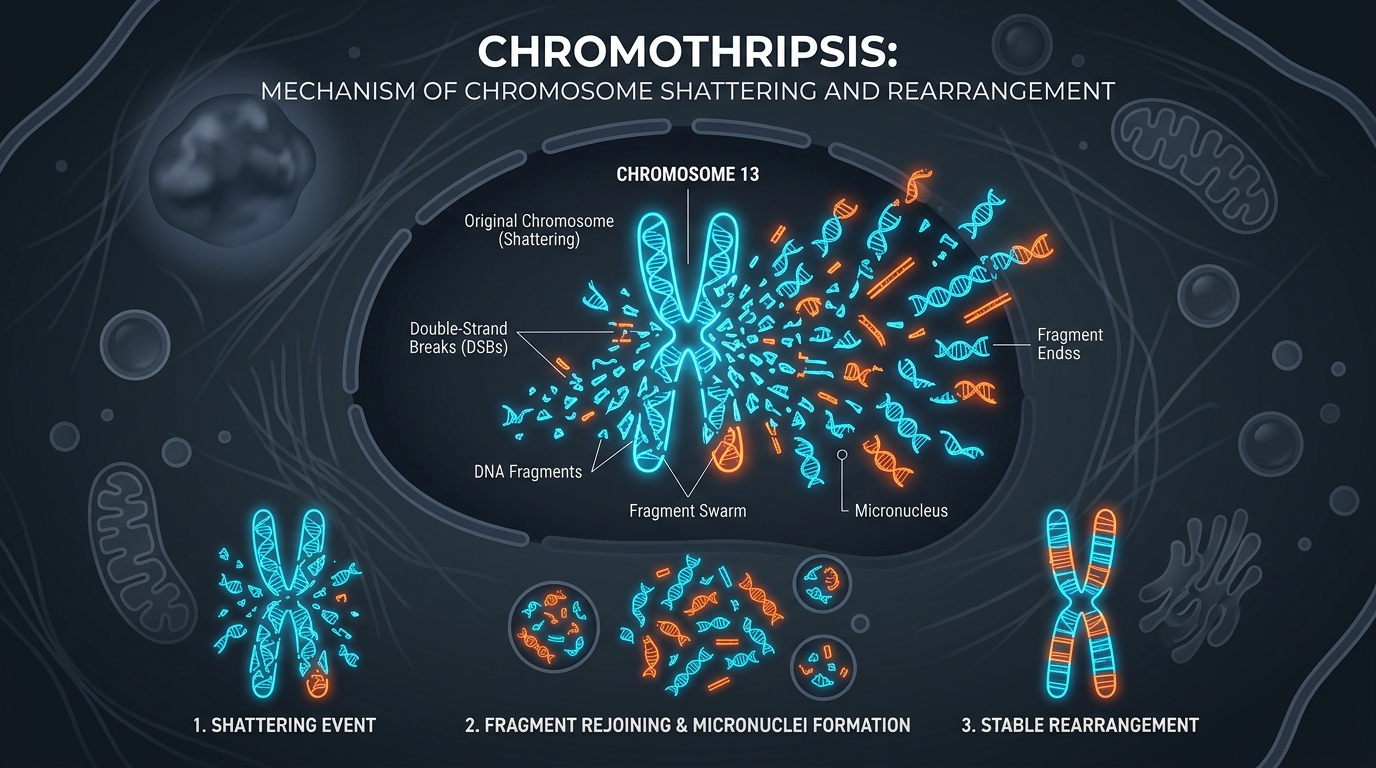
How does a cancer genome acquire hundreds of structural rearrangements? The traditional model of cancer progression asserts that genomes evolve through a gradual, step-wise accumulation of mutations over years. However, recent genome sequencing has revealed a dramatic counter-narrative: chromothripsis, a single catastrophic burst where one or a few chromosomes are shattered into dozens to hundreds of pieces and stitched back together in a chaotic order.
In this post, we explore the cell biology behind chromothripsis, contrast it with standard genome rearrangement models like Double Cut and Join (DCJ), and discuss how computational biologists are adapting models using $k$-break rearrangements to capture the reality of simultaneous genomic catastrophes.
1. The Biology of Chromothripsis
The term chromothripsis (Greek for chromosome shattering) was coined in 2011 by Stephens et al. to describe a mutational signature characterized by clustered breakpoints localized to a single chromosome or arm, with alternating copy number states (typically fluctuating between two states: copy-number neutral and deleted).
Biologists have identified two primary mitotic errors that trigger this catastrophe:
A. The Micronucleus Model (Whole-Chromosome Shattering)
During cell division, if a chromosome fails to segregate properly to either spindle pole (a lagging chromosome), it can become trapped outside the main nucleus at mitotic exit. A separate membrane, called a micronucleus, forms around it.
- Envelope Collapse: The micronuclear envelope (micro-NE) is structurally unstable and prone to irreversible collapse during interphase.
- Replication Stress & Shattering: Rupturing dilutes critical replication machinery, halting DNA synthesis and exposing the chromosome to cytosolic nucleases. When the cell enters the next mitosis, this under-replicated, damaged chromosome is prematurely condensed and shattered.
- Ligation: The resulting acentric fragments are distributed to the daughter cells, where canonical Non-Homologous End Joining (c-NHEJ) stitches them back together in a random, scrambled order.
B. The Chromatin Bridge Model (Focal Chromothripsis)
If a chromosome acquires two active centromeres (a dicentric chromosome, often due to telomere-to-telomere fusion), it can be pulled to opposing poles during division, creating a chromatin bridge that spans the two daughter cells.
- Exonuclease Digestion: During G1 phase, the nuclear envelope surrounding the stretched bridge ruptures. The cytoplasmic 3′ exonuclease TREX1 gains access to the exposed DNA and cleaves it.
- Signature: Because the cleavage is localized, the resulting rearrangements are focally restricted to a specific region or arm. This is frequently accompanied by kataegis (clustered hotspots of cytosine mutations).
2. Pan-Cancer Prevalence and Genomic Signatures: The PCAWG Study
To understand the real-world impact and frequency of this phenomenon, the Pan-Cancer Analysis of Whole Genomes (PCAWG) Consortium conducted a landmark analysis of 2,658 tumors spanning 38 cancer types using whole-genome sequencing (WGS) data (Cortés-Ciriano et al., 2020).
Using the computational tool ShatterSeek, they uncovered several critical insights that redefined our view of chromothripsis:
A. Pervasiveness and Tumor-Type Specificity
While SNP array-based studies previously estimated chromothripsis to occur in only 1.5% to 5% of cancers, WGS data revealed that it is highly pervasive:
- Overall Frequency: High-confidence chromothripsis was detected in 29% of all tumors (increasing to 40% if low-confidence calls are included).
- Extreme Variation: Some cancers exhibit near-universal chromothripsis. It was found in 100% of liposarcomas and 77% of osteosarcomas, and surpassed 50% in glioblastomas, skin melanomas, and lung adenocarcinomas. Conversely, it is extremely rare in thyroid adenocarcinomas (3.3%) and chronic lymphocytic leukemia (1.2%).
- Multichromosomal Events: While 40% of chromothripsis cases affect only a single chromosome, the other 60% are multichromosomal, involving interchromosomal SVs (e.g., at least 5 chromosomes are affected in 61% of osteosarcomas).
B. Predisposing Factors: TP53 and Polyploidy
The study highlighted a strong link between cell cycle checkpoints, ploidy, and chromothripsis:
- TP53 Mutational Status: Inactivating TP53 mutations are strongly correlated with chromothripsis (odds ratio of 1.54 compared to TP53 wild-type).
- Polyploidy: The odds of chromothripsis in a polyploid tumor are 1.5 times larger than in a diploid tumor. Interestingly, in 74% of canonical cases where the timeline could be established, chromothripsis occurred after polyploidization, suggesting that the chromosomal instability of newly established polyploid cells drives subsequent shattering.
- p53-Proficient Diploids: Despite these risk factors, 60% of chromothripsis cases occurred in diploid tumors with wild-type TP53 and no MDM2 amplification, showing that p53 inactivation is not a strict prerequisite.
C. Reassembly Signatures: NHEJ vs. Replicative Processes
Analyzing breakpoint junctions in canonical chromothripsis cases revealed that reassembly is not always mediated by standard end-joining:
- Canonical End-Joining (55%): The majority of cases showed repair signatures consistent solely with NHEJ or alternative end-joining (alt-EJ).
- Replication-Associated Repairs (32%): A significant fraction displayed short stretches of microhomology (0-6 bp) and small templated insertions (10–500 bp), indicating contributions from Microhomology-Mediated Break-Induced Replication (MMBIR).
- Chromoanasynthesis (5%): In diploid tumors, about 5% of events showed low-level copy number gains without Loss of Heterozygosity (LOH) and extensive template-switching, showing that replicative processes can construct chromothripsis-like configurations in a single step.
D. Oncogenic Drivers and Gene Inactivation
Chromothripsis acts as a powerful driver of tumorigenesis by reshaping key loci:
- Oncogene Amplification: Roughly 11% of small-scale focal amplifications of oncogenes (such as CCND1, CDK4, MDM2, and MYC) co-localize with chromothripsis regions, often resulting in massive copy-number changes via double minutes or neochromosomes.
- Tumor Suppressor Loss: Chromothripsis is directly responsible for about 2% of the losses of tumor-suppressor and DNA-repair genes, including PTEN, BRCA1, BRCA2, APC, TP53, and MLH1 (the loss of which can trigger a microsatellite-instability phenotype).
3. Modeling Genome Rearrangements: The Classical DCJ Model
To study how genomes reorganize over time, computational biologists rely on genome rearrangement models. The most popular and mathematically elegant of these is the Double Cut and Join (DCJ) model, formalized by Yancopoulos et al. (2005) and Bergeron, Mixtacki, and Stoye (2008).
How DCJ Works
In the DCJ model, a genome is represented as a collection of adjacencies (connections between chromosomal segments) in an adjacency graph. A single DCJ operation performs two cuts on adjacencies and rejoins the four exposed ends in a new configuration. This single operation acts as a unified mechanism representing:
- Inversions (reversing a segment)
- Translocations (exchanging segments between chromosomes)
- Fusions and Fissions (joining or splitting chromosomes)
DCJ Operation (2-break):
Before:   A — B   and   C — D
Cuts:     A [x] B  and  C [x] D
Joins:    A — C   and   B — D   (or A — D and B — C)
The Advantages of DCJ
The DCJ model is highly efficient:
- Distance Calculation: The minimum number of DCJ steps (the DCJ distance) required to transform one genome into another can be computed in linear time $O(n)$ using the cycles and paths in the adjacency graph.
- Optimal Sorting: Shortest paths of sequential 2-break rearrangements can be calculated rapidly.
4. The SV Chronological Order Issue
While the DCJ model is incredibly useful for calculating evolutionary distances, it encounters a major roadblock when reconstructing the actual chronology of structural variations (SVs).
A. Non-Uniqueness of Shortest Paths
If you have a highly rearranged genome, there are typically thousands or millions of different optimal paths of the same minimum length. Standard DCJ algorithms cannot distinguish between these mathematically equivalent sequences. Without additional biological constraints (like single-cell phylogenies or copy number changes), determining which sequence actually occurred historically is impossible.
B. Sequential vs. Simultaneous Conflict
This is where the biology of chromothripsis directly clashes with the assumptions of DCJ:
- The Parsimony Assumption: DCJ assumes that rearrangements occur step-by-step (one-by-one).
- The Reality of Shattering: Chromothripsis shatters a chromosome into $M$ fragments, which are reassembled in a single cell cycle.
- The Modeling Failure: If we feed a chromothriptic genome into a standard DCJ model, the algorithm will attempt to represent the event as a sequence of multiple independent 2-break steps. It will claim that “rearrangement 1 happened, then rearrangement 2, then rearrangement 3,” which is a false biological chronology.
5. The Solution: $k$-Break Rearrangements
To bridge the gap between biological reality and mathematical modeling, researchers use $k$-break rearrangements.
A $k$-break operation cuts $k$ adjacencies simultaneously and rejoins the $2k$ ends in a new configuration. Under this framework:
- A 2-break is a standard DCJ operation.
- A 3-break can represent transpositions and block interchanges in a single step.
- An $n$-break (where $n$ is large) represents a chromosome-shattering event like chromothripsis in a single step.
k-break Operation:
Cuts:     Adjacency_1, Adjacency_2, ..., Adjacency_k
Joins:    Scrambled re-ligation of all 2k ends in 1 step
The Trade-offs of the $k$-break Model
While $k$-breaks allow us to model chromothripsis as a single step, they introduce significant computational and modeling challenges:
| Challenge | Explanation |
|---|---|
| The “Unbounded $k$” Triviality | If $k$ is allowed to be arbitrarily large without penalty, the distance between any two genomes is always 1 (a single $n$-break). We lose the ability to measure evolutionary distance. |
| Cost Functions $C(k)$ | To make the model useful, we must define a cost function where a standard 2-break is cheap, but a massive $k$-break is heavily penalized. Selecting and tuning this cost function is a major research problem. |
| NP-Hardness | Unlike the linear-time DCJ model, finding the most parsimonious sorting scenario using a mix of 2-breaks and $k$-breaks is an NP-hard problem due to the exponential combinations of joining $2k$ ends. |
| Handling Fragment Deletions | Traditional $k$-break models assume all cut ends are conserved and rejoined. In chromothripsis, massive deletions occur due to lost acentric fragments. The model must be extended to support $k$-breaks with deletions. |
6. Conclusion
Chromothripsis has changed how we view genome instability. Rather than being a gradual process, cancer genomes can undergo massive, punctuated reorganizations overnight.
While classical models like DCJ (2-breaks) remain the workhorse of comparative genomics for progressive evolutionary changes, the development of constrained and penalized $k$-break models is essential for accurately capturing genomic catastrophes. Modern bioinformatics workflows are increasingly combining these models with single-cell sequencing and copy-number profiles to reconstruct the true, non-stepwise history of cancer genomes.
References
- Stephens, P. J., et al. (2011). “Massive genomic rearrangement acquired in a single catastrophic event during cancer development.” Cell, 144(1), 27-40.
- Ly, P., & Cleveland, D. W. (2017). “Rebuilding Chromosomes After Catastrophe: Emerging Mechanisms of Chromothripsis.” Trends in Cell Biology, 27(12), 917-930.
- Cortés-Ciriano, I., Lee, J. J. K., Xi, R., et al. (2020). “Comprehensive analysis of chromothripsis in 2,658 human cancers using whole-genome sequencing.” Nature Genetics, 52(3), 331–341.
- Yancopoulos, S., et al. (2005). “Efficient sorting of genomic permutations by translocation, inversion and block interchange.” Discrete Applied Mathematics, 150(1-3), 229-244.
- Bergeron, A., Mixtacki, J., & Stoye, J. (2008). “The double cut and join model of genome rearrangements.” Theoretical Computer Science, 395(2-3), 172-192.
Enjoy Reading This Article?
Here are some more articles you might like to read next:
- $1.8 Billion for AI-Ready Biology: A Bioinformatician's Take on the Virtual Biology Initiative Expansion
- From Bench to Bedside: A Practical Guide to Using Large Language Models in Medical Research
- Rethinking Bioinformatics Expertise in the Era of AI: A Newbie's Journey as a Custodian
- Mapping the Global Landscape of Cancer Research: Key Trends from the Nature Index
- Diffusion LLMs
- Nanopore raw data visualization using squigualiser
- Nanopore direct RNA data analysis using Dorado
- Modern commnad line tools powered by Rust
- Nanopore direct cDNA data analysis
- Hi-C data analysis